No products
BLOG NEWS
 USING A 16x2 LCD DISPLAY WITH THE IoT PROTO SHIELD PLUS
  What does Paolo Aliverti say about the IoT Proto Shield Plus?
  USING AN SSD1306 128x32 OLED DISPLAY (I2C type) WITH THE IoT PROTO SHIELD PLUS
  USING AN SSD1306 128x64 OLED DISPLAY (I2C type) WITH THE IoT PROTO SHIELD PLUS
  I2C Bus on the IoT Proto Shield Plus
 Search on blog
Follow us on facebook
Top sellers
-

Proto Shield Plus STARTER KIT
This kit is the ideal solution for those who want to start to prototype...
69,90 € -

Proto Shield Plus LCD KIT
Prototype with ARDUINO / GENUINO boards without having a lot of wires...
56,00 € -

SMD to breadboard adapter (10 pcs pack)
Easily adapt SMD devices to 2.54mm prototyping breadboards.
3,90 € -

Proto Shield Plus BASE KIT
Prototype with ARDUINO / GENUINO boards without having a lot of wires...
52,00 €
VISUAL MICRO for ATMEL STUDIO - DEBUGGING YOUR ARDUINO CODE
Published : 10/16/2018 21:33:19
Categories : Proto Shield Plus

VISUAL MICRO for ATMEL STUDIO - DEBUGGING YOUR ARDUINO CODE
This is not intended to be an exhaustive tutorial covering all the debugging features of Visual Micro for Atmel Studio, it is just a sneak peek to start looking at this feature.
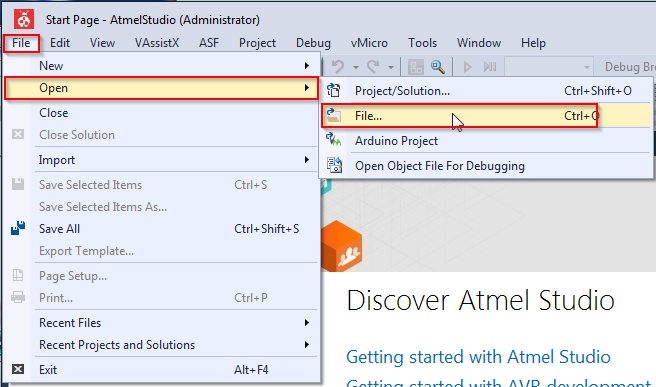
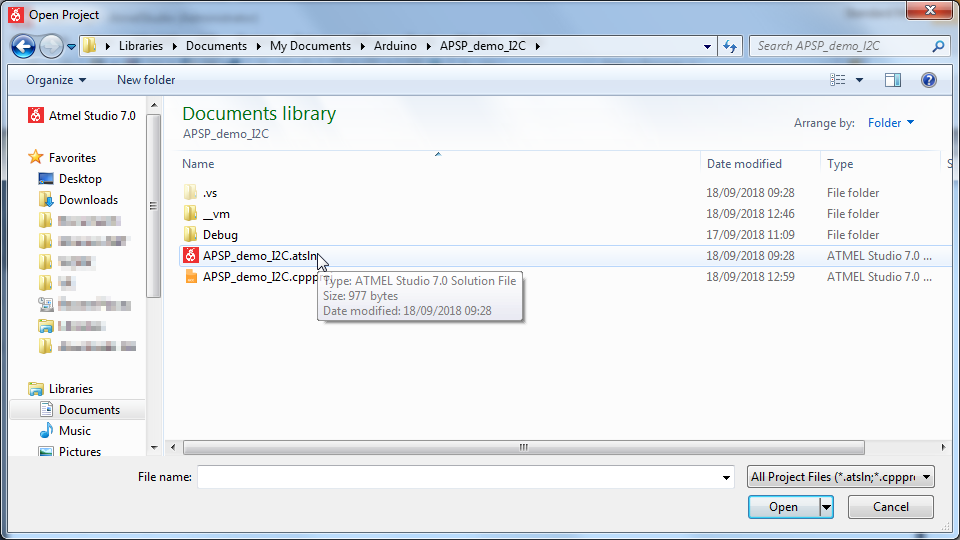
First of all let’s open an Arduino sketch file
Let’s start opening an existing .ino file.
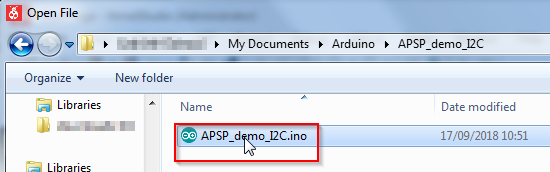
i.e. Let’s open the APSP_demo_I2C.ino available from the Proto Shield Plus sample sketches (https://www.gtronicsshop.com/en/index.php?controller=attachment&id_attachment=2).
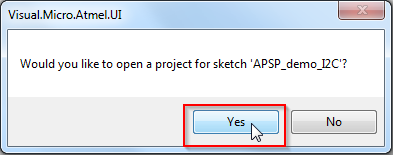
Once opened, your code will be shown in the code window.
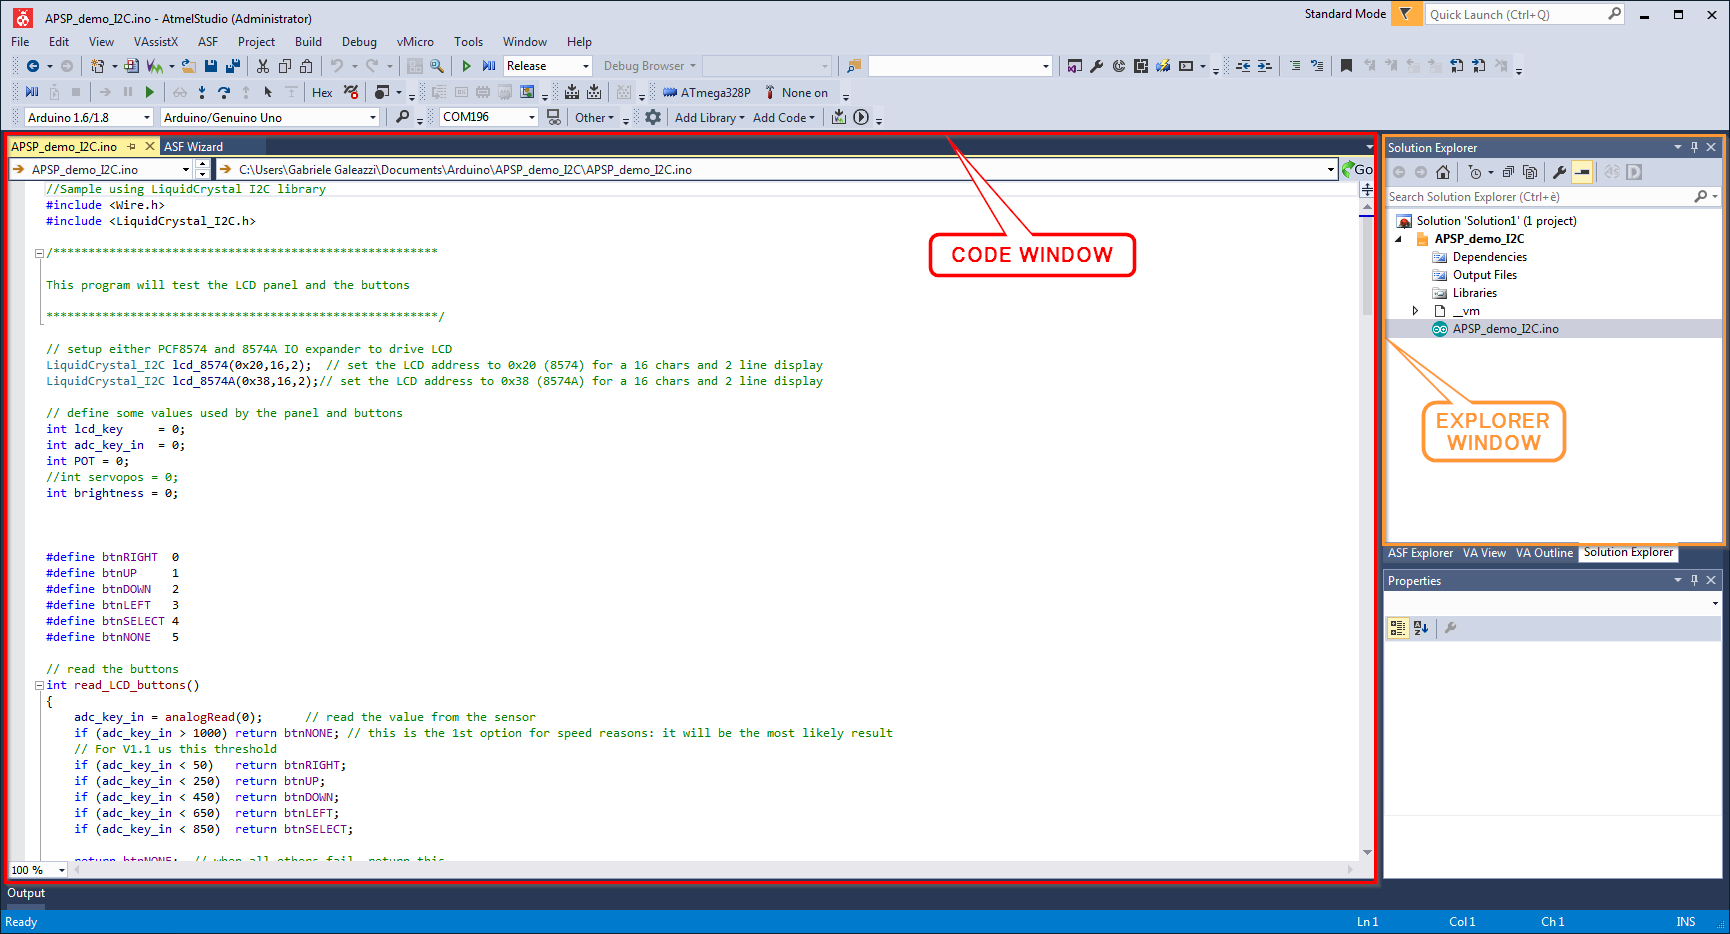
We’re now ready to start discovering the Visual Micro IDE debugging features.
Open an existing Atmel Studio project file
If you have an existing Atmel Studio project (.atsln) file you can directly open it.
i.e. In case you red the article (VISUAL MICRO for ATMEL STUDIO FEATURES) and you tested the features as it describes, you should have the APSP_demo_I2C.atsln available.
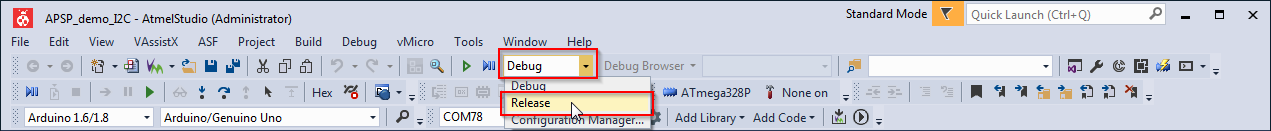
Configure the project for debugging
In the Solution Configurations drop down menu select Debug.

Your project is now ready to be debugged.
Breakpoints
With breakpoints you can:
- Pause your code execution (and continue on your input)
- Always
- When certain conditions are met
- Probe variables value
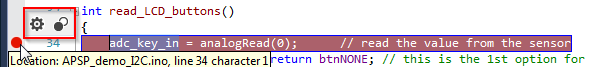
Setting a new breakpoint
To set a new break point, just position the mouse pointer on the left side of the line where you want to insert the breakpoint.
Now assume that you want to monitor adc_key_in variable value in read_LCD_buttons() function (line 34).

As soon as you click, a red dot will appear indicating that the new breakpoint has been created.
By default a new breakpoint will act like it is supposed to be: it will pause the execution of your code.
By clicking the Build and Upload button ![]() your project will be compiled and uploaded to your Arduino board.
your project will be compiled and uploaded to your Arduino board.
The Output window will appear showing the compile and upload process status.
At the end of the upload, the program will start running….and then it will pause on line 34 waiting for your action.
On the output window shows the sequence of actions:
- Program Running
- Execute Line 34
- Pause on line 34

Click the Continue button ![]() (or press F5) to resume code execution.
(or press F5) to resume code execution.
The code will start and run till execution of line 34… then it will pause again.

Stop debugging session
If you want to add or remove a breakpoint (or change breakpoint settings), you need to stop the debugging session by clicking the Stop Debugger button![]()
Make your modification to the breakpoints and then Build and Upload![]() your project to let it run with the new breakpoints settings.
your project to let it run with the new breakpoints settings.
Breakpoint Actions
Now let’s assume that you want to probe the value of adc_key_in variable on line 34.
Positioning the mouse over the red dot of the breakpoint, a little pop-up shows.
Click on the Settings… button

The Breakpoint Settings window appears

Select the Actions checkbox

to expand the Actions setting section

You can now choose a message to show in the Output Window and you can also choose to Continue or Stop code execution.
To probe the adc_key_in variable, you just have to insert:
{adc_key_in}
![]()
Everything that is in between curly brackets is interpreted as the variable to probe.
Now Build and Upload![]() your project to let it run with the new breakpoints settings.
your project to let it run with the new breakpoints settings.
Once the project is uploaded, you will have:
- The new popped up Expression Window: it shows the current, the minimum and the maximum value of the variable
- The Serial Monitor Window: it shows the serial communication with the Arduino board (in case that you are using serial communication)
- The Output Window: it shows the custom message log (in this case there is no custom message, we will see the custom message soon…)

The Output Window shows some useful additional informations:
- The Execution Timestamp for each execution of line 34
- The time elapsed between one execution and the next one

Now try to click the Proto Shield Plus buttons to check the corresponding value on the adc_key_in variable.
Custom message to the Output Window
If you want to log a custom message, just stop debugging (as explained before), click on {adc_key_in}

And add your custom message
i.e. Current adc_key_in value is: {adc_key_in}
![]()
Build and Upload![]() your project to let it run with the new breakpoints settings.
your project to let it run with the new breakpoints settings.
The Output Window now shows your custom message…
Continue or Stop execution
The Action settings let you to stop or continue the code execution.
To just probe a variable value Continue execution checkbox must be selected.
![]()
If you want to stop code execution just uncheck Continue execution checkbox.
![]()
Conditional breakpoint
Now suppose that you want to probe adc_key_in value, only when a certain condition is met.
Just select the Conditions checkbox, the Breakpoint Settings window expands showing you the Conditions fields.
In the example below the breakpoint will execute only when adc_key_in value is less than 600.

Build and Upload![]() your project to let it run with the new breakpoints settings.
your project to let it run with the new breakpoints settings.
You notice that the Expression Window and the Output Window, even clicking the A-SELECT button on the Proto Shield Plus, are not logging any information…
That’s because adc_key_in value is greater than 600.

But as soon as you click the B-LEFT button on the Proto Shield Plus, the Expression Window and the Output Window start showing adc_key_in value.
And, as you can see, its value is lower than 600.

The same happens if you click the C-DOWN button on the Proto Shield Plus….
You will also notice that, as soon as you release the buttons, the Expression Window and the Output Window stop logging the current adc_key_in value.
Now experiment by yourself with different Conditions...
Disabling breakpoints
Disabling breakpoints is very useful: by disabling a breakpoint it will not be compiled and executed, but you do not lose its settings. So if you want to turn it on again, you just have to enable it without setting it up from scratch.
To disable a breakpoint, just place the mouse pointer over the red dot, and the little pop-up shows.
Notice that even a pop-up showing the current breakpoint settings shows. This pop-up is very useful when you want to monitor breakpoints settings while their Settings window are “contracted”.

Click Disable Breakpoint and that’s it…the breakpoint is disabled.

Now just remember that if you want to contract the Breakpoint Settings Window, you have to click the Settings button or the X of the Breakpoint Settings window.

DO NOT CLICK THE RED DOT, otherwise the breakpoint will be DELETED.
Understanding breakpoint symbols

Conclusion
Of course you can implement your own debugging, using the serial monitor provided with the Arduino “standard” IDE, but you have to write additional code to do that.
Visual Micro IDE do it for you and, of course, having these features ready to be used with such an easy interface is really useful and handy!
Just consider that under the hood, it consist in additional extra hidden code that do the debugging serial communication, so consider it if you’re dealing with time critical applications!
When you’re done debugging, just remember to switch the Solution Confirurations back to Release.
It will remove all the additional extra hidden code added by Visual Micro for debugging.


INSTALLING VISUAL MICRO for ATMEL STUDIO
Read more
Published : 09/10/2018 16:18:11
VISUAL MICRO for ATMEL STUDIO FEATURES
Read more
Published : 09/18/2018 15:28:30